
How Low Will it Go?
How Low Will it Go?
Written during the dark early days of COVID-19, in April 2020.

In their excellent book, Superforecasting, Philip Tetlock and Dan Gardner make the case that there are two ways to look at any situation: the “inside view” and the “outside view.” The inside view looks at the specifics of the situation and tries to make judgements about how it will play out. The outside view looks at historical precedents for that situation, and tries to anchor predictions to those historical examples.
In an investing context, taking an “inside view” of a particular investment opportunity (say, equity in a company) means looking at all the specifics of that business and trying to make a judgement: what is the company’s value proposition to customers, competitive positioning, “moat,” strength of management, etc. These are all the things investors look at before making a call. The outside view would entail looking at historical precedent: how have companies in this industry done historically, how have companies with a similar level of management ownership done historically, how have companies with a similar leverage profile done historically, etc.
Over time, fundamentals-based investors develop an intuition for the “outside view.” This intuition is called experience. However, they spend most of their day-to-day time working on their “inside views.” As Tetlock and Gardner explain in their book, a combination of both views is required to produce accurate forecasts.
The current COVID-19 pandemic provides a case study. I looked at every bear market in the United States (based on the S&P 500) since 1928 in order to put this decline in perspective.
I did this analysis as I was working out my investment plan for the current situation. We all know that we are supposed to put money to work in market declines, but how much? And when? Should we buy in slowly or put large sums of money to work on down days?
I hope that this kind of analysis will provide a useful “outside view” on the situation. The following table shows the 21 bear markets that I looked at, from 1928 onwards. I conducted my analysis using monthly S&P 500 data provided by Robert Shiller. All the data is in real, total return terms. This, combined with the monthly granularity, means that the numbers could look a bit different from numbers you might find elsewhere. For example, in the 2008 recession, the S&P declined 57% peak-to-trough based on daily closes, but this data only shows a 49.9% decline because it uses monthly data.
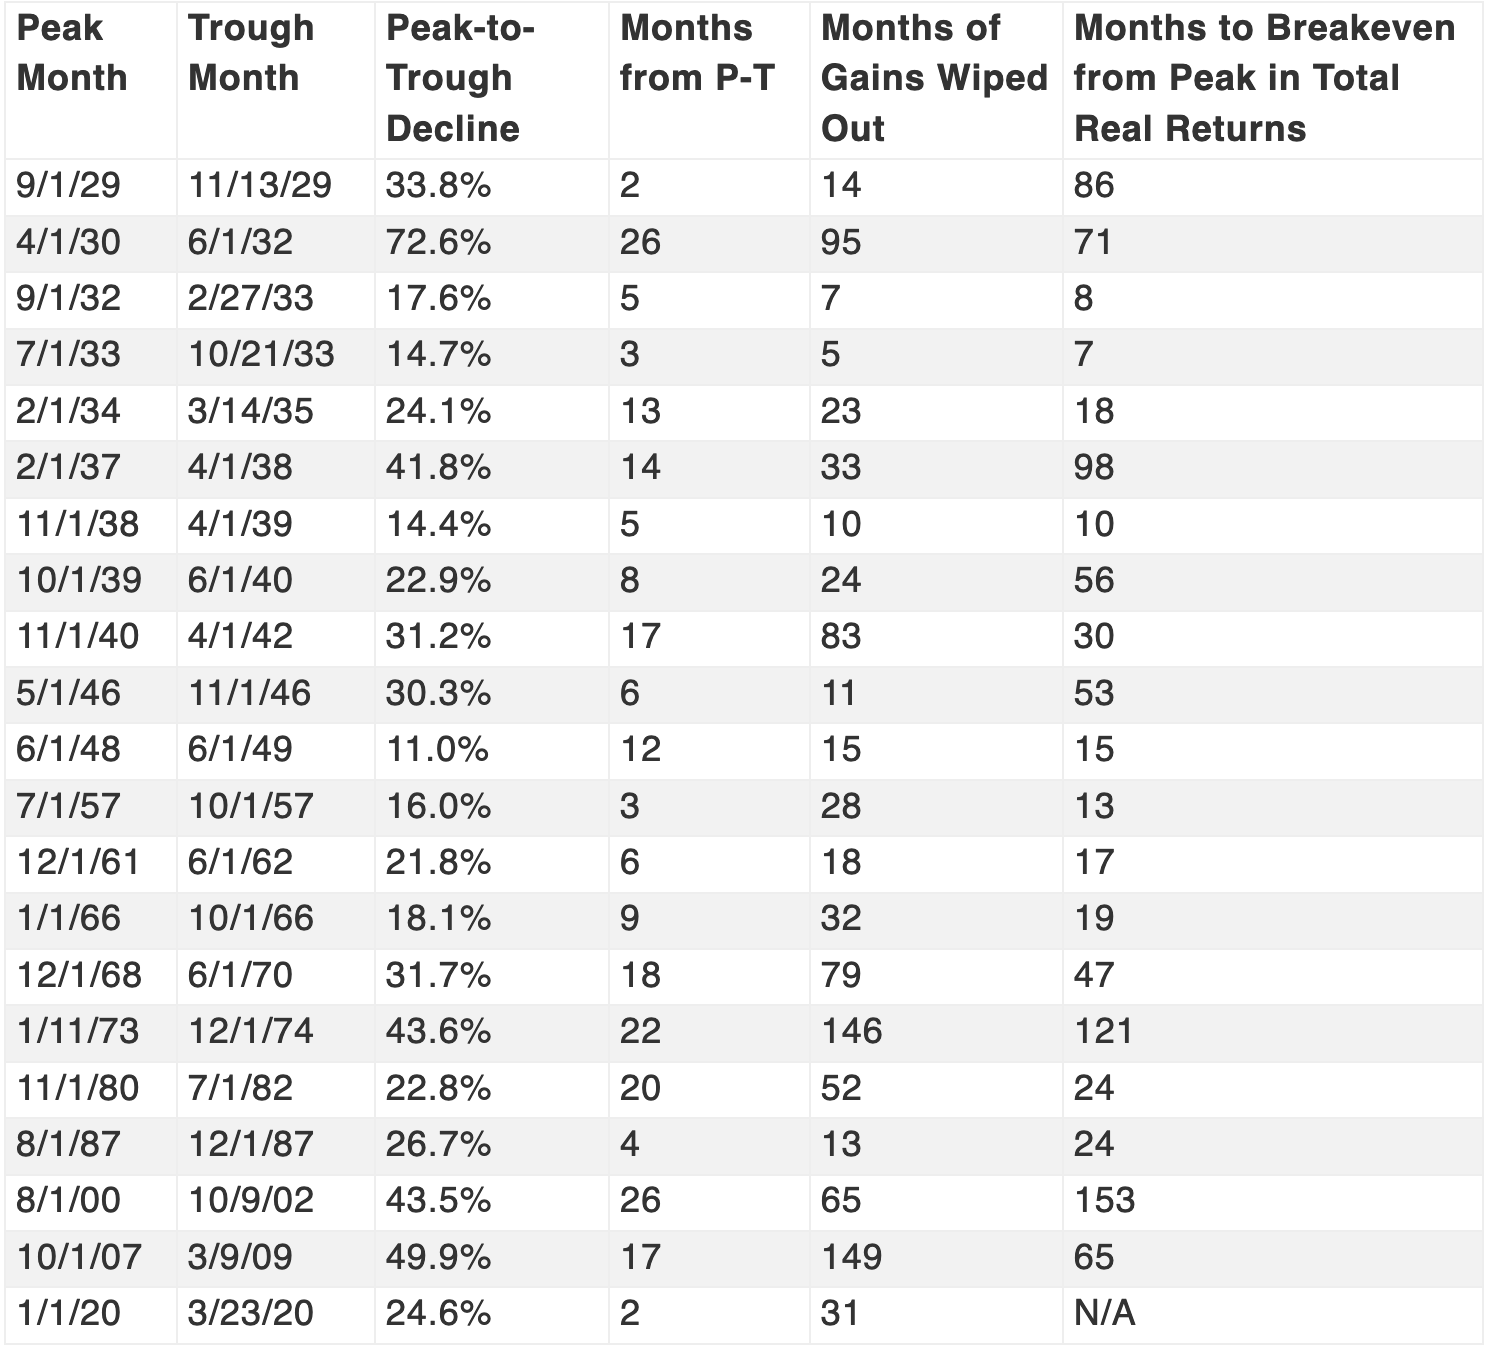
We can answer some key questions. How long can we expect a bear market to last before hitting a bottom?
Average: about 11 months, but with wide dispersion.
Median: 9 months.
Shortest: 1929, 2 months. This was followed by larger drops immediately after, so I’d consider the “true” shortest to be 3 months in 1957.
Longest: 1930-32 and 2000-02, 26 months (more than 2 years!).
We’re only 1-2 months into this decline, so without further declines, this would be the shortest bear market in recent U.S. history. Based purely on historical precedent, we would expect further declines.
How much pain do bear markets typically inflict (how many months of gains do they wipe out)?
Average: about 44 months, again with wide dispersion.
Median: 28 months.
Least: 1933, 5 months. This was a period of great volatility in the Great Depression. Outside of the Great Depression era, the shortest was 11 months in 1946.
Most: 2007-09, 149 months.
This current decline has wiped out 31 months of gains so far. That’s right around the median.
How long can we expect a recovery to take (in real, total terms)?
Average: about 46 months.
Median: 27 months.
Least: 1933, 7 months. Outside of the Great Depression, 13 months in 1957.
Most: 2000-02, 153 months. This shows you how large of a bubble we were in at the end of the 90s. It took almost 13 years to recover in real terms! The forward P/E ratio for the S&P was 27x at that time, and the 10-year treasury was ~6% vs. <1% today.
This is obviously not a novel insight, but equities are risky! If you invested with a time horizon of less than 10-15 years, there was a non-trivial chance you would be left underwater. On the flip side, if you had a long enough time horizon, you would eventually break even, regardless of when you invested.
What does this all mean in the context of COVID-19? Historically speaking, equities could very possibly go lower, but if you have a long time horizon, you can’t go wrong with continuing to invest now. Just don’t fixate on your mark-to-market losses once you do!
Obviously, however, COVID-19 is a unique situation with unprecedented volatility and government intervention, and can’t be fully explained in the context of historic market events. To take an “inside view,” I wanted to see how quickly we can expect the market to recover post-COVID, by looking at market performance internationally, including in countries where disease spread has largely been contained (i.e. China).
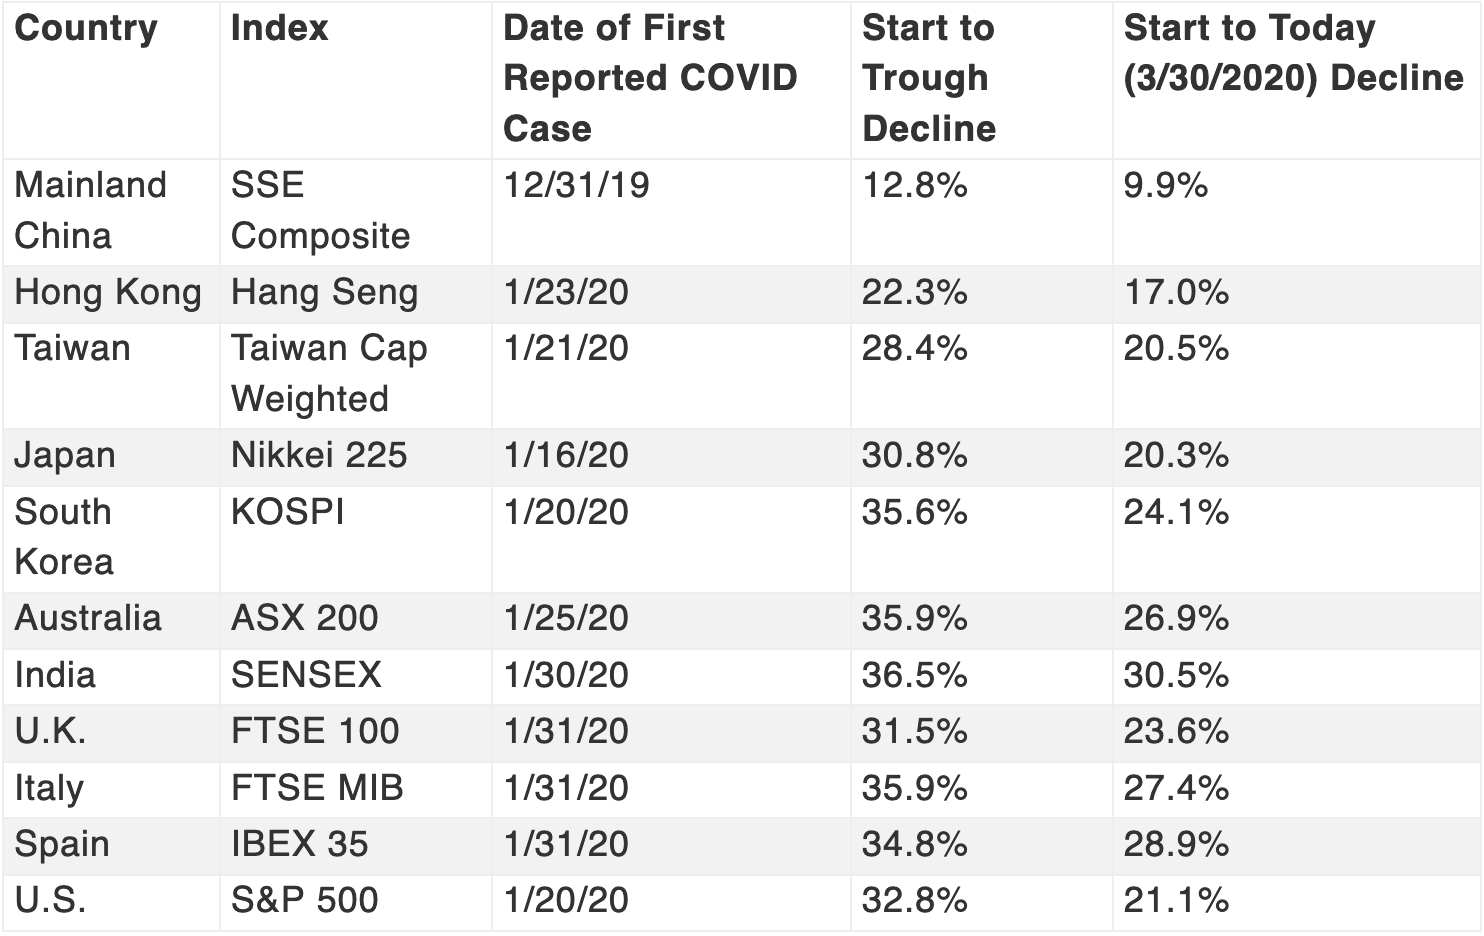
Mainland China is down ~10% relative to pre-COVID, which would suggest that a fairly complete recovery is possible post-COVID. However, there is an interesting pattern. China/HK fared far better than every other country, even at the troughs (China down ~13% and HK down 22% vs. almost every other country down 30+%). This suggests that markets were never as concerned about economic damage in China compared to elsewhere.
I’m not sure exactly why this is, but I’ll speculate. It likely has to do with the draconian measures the Chinese government took to contain the virus, which meant that China was likely to enter a sharp, but brief, period of economic decline. Most people generally agree that it’s the duration and not the depth of the recession that matters, and strict measures in China made a V-shaped recovery more likely.
Unfortunately, this means that China’s example doesn’t provide us useful priors to project a market recovery in the U.S. If the lockdowns last 2 months or less, the economic effect would be similar to that of a natural disaster such as a hurricane and we can expect an outcome similar to China (a decent recovery). In the event they last longer, we are in uncharted territory.
All of this means that I don’t have any deterministic answers for what to expect going forward. However, historical bear market data suggests you shouldn’t be surprised by further declines until things get better. But, things will get better. The example of China’s recovery as well as American recoveries after every bear market historically indicate that the situation will improve. As for an investment plan, staying invested is the most important thing to do. If you have the capability, adding will likely benefit you as well.